LEARNINGPULSE · GOTLEARNING

IN PRODUCTION

Helping teachers understand student work

LearningPulse helps teachers identify where students need support and check the student work behind each AI insight.

At gotLearning, I led product direction, wrote requirements, tested prototypes with pilot teachers, and built the interface in Vue and TypeScript.

LearningPulse brings together a class overview, student performance, and the evidence behind each rating.
LearningPulse brings together a class overview, student performance, and the evidence behind each rating. Demonstration data; student names fictional.
ROLE
UX Developer / Product Designer
DesignEngineeringProduct
TIMELINE · STACK
June 2025 to present
Vue · TypeScript · FastAPI · SQL
6
NJ district pilot signups
3
conference invitations
LearningPulse analyzed 300 documents in about 5 minutes.
TL;DR

Pilot teachers needed less to read and evidence for every student. I used that feedback to shape V2 around a quick overview, familiar criteria, and student work teachers could check. Group Analysis and Growth Over Time are both live as of September 2026.

Reviewing an entire grade’s work can take days. Teachers wanted help answering a familiar question: “Where are my students in their learning?” The challenge was making the analysis useful enough to guide their next lesson and clear enough for them to check.

WHAT TEACHERS NEEDED
DIFFERENT INPUTS
Student work varies in format, readability, and completeness.
INCOMPLETE RESULTS
AI analysis can return partial or inconsistent information.
USEFUL NEXT STEPS
Teachers need to understand what the results mean for their students.
01 · PILOT FEEDBACK

Teachers needed less to read and more evidence

Our first release, in February 2026, paired summaries with selected excerpts from student work. Teachers valued the excerpts because they could check the analysis against what a student had written. But the summaries added more reading, and the selected examples left too many students out.

V1 paired written summaries with selected examples from student work. Demonstration data; student names fictional.

“There's a lot of information here… sometimes there's more to read in the analysis than in the student work itself.”

Pilot teacher, on V1
KEPTWHAT WORKED
THE CLAIM
Excerpts helped teachers check the analysis and decide whether they agreed.
CHANGEDWHAT NEEDED TO CHANGE
Evidence for about 5 of 30 students
Long summaries were difficult to scan, and the evidence covered only about 5 of 30 students.
THE TRADEOFF
I had pushed for evidence for every student. We initially shipped selected examples because of time and processing cost constraints. Pilot feedback helped make full coverage a requirement for V2.
02 · EXPLORING WRITING METRICS

Choosing information teachers could act on

The feedback also raised a bigger question: which information would help teachers plan their next lesson? We explored writing metrics such as clarity, sentence structure, and syntactic variety. Teachers could read the charts, but struggled to connect the patterns to what they should teach next.
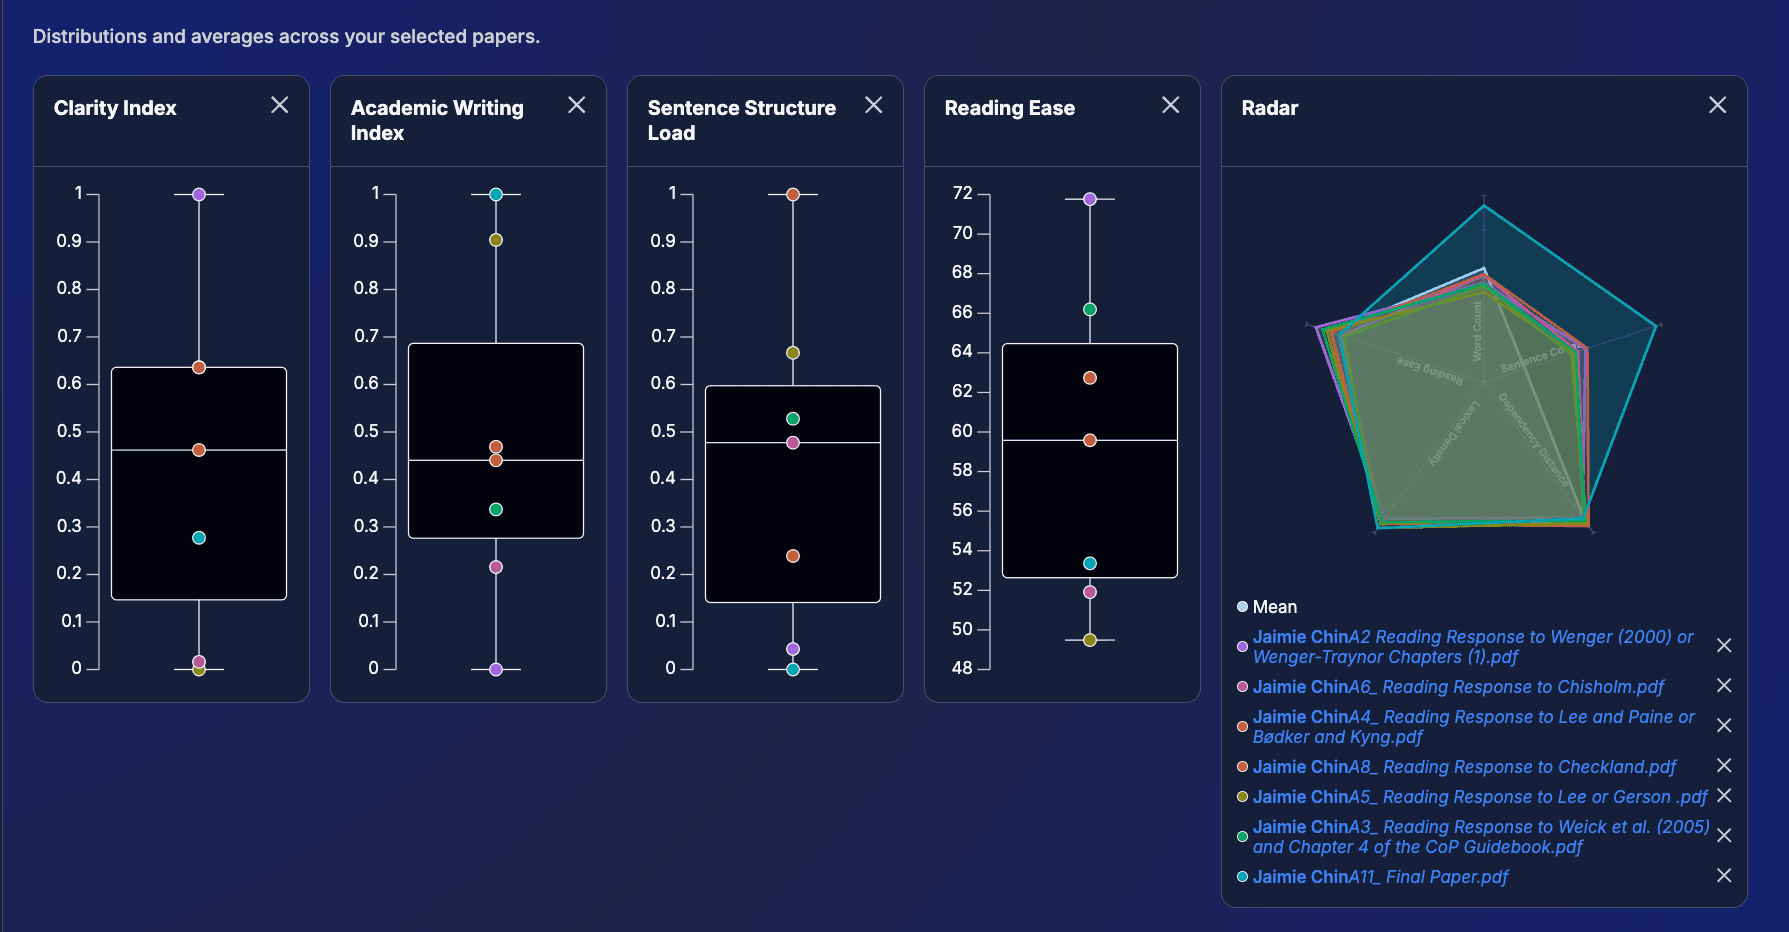
Explored, then set aside
An early exploration of writing metrics across a class.

“This looks cool and interesting — but I'm not sure how I would use this information.”

Pilot teacher, on the cluster view
WHAT I TOOK FROM THE FEEDBACK
I evaluated the metrics against the decision teachers needed to make: what should I teach next?
Clarity
Academic writing index
Sentence structure
Syntactic variety
Reliable as a measurement?
Helps a teacher plan the next lesson?
HOW I WEIGHED IT
The case for keeping it
The metrics offered a detailed view of student writing, and teachers could understand the charts.
What decided it
Understanding a chart of syntactic variety still left teachers unsure what to do next. Improving the presentation alone would not resolve that gap.
WHAT WE DID INSTEAD
We set the writing metrics aside and built the analysis around criteria teachers already use. Each assessment would point to something they could check in a student’s work.
03 · V2

Making the analysis easier to use and check

Both explorations pointed to the same direction: less interpretation for teachers and a clearer connection to student work. I translated that feedback into three priorities for V2: a quick overview, familiar criteria, and evidence for every student.

EARLIER VERSIONS
V2
Selected student examples
Evidence for every student
Long written summaries
Quick Read and performance bands
General writing metrics
Criteria teachers use
Broad recommendations
Next steps for each performance band

Group Analysis

Teachers start with a Quick Read of the class, then explore each criterion by performance band. From there, they can open a student’s work and check the evidence behind a rating. This connects the class overview with the individual work that explains it.

Open a criterion, choose a performance band, and review the student work behind a rating.
Highlighted passages connect each rating to the student’s work.
Compare students’ performance across the same criteria in one view.

Growth Over Time

A class overview shows where students are now. Growth Over Time helps teachers see what has changed across assignments using the same criteria. When the work does not show improvement, the analysis can report “No Clear Change” so teachers can review the evidence without an assumption of progress.

Compare a student’s work across assignments and review the evidence behind changes in performance.
04 · DESIGN & DEVELOPMENT

Making uncertainty clear in the interface

The same need for clarity shaped the implementation. Uploads can be incomplete, and AI analysis can return only part of a result. I designed and built states that explain what is available, what is missing, and what a teacher can do next.

SIX ANALYSIS STATES
function render(section: Section) {
switch (section.status) {
case 'complete': return Criterion(section.band, section.evidence)
case 'partial': return Criterion(section.band, section.evidence, section.gaps)
case 'no_signal': return NoClaim(section.title)
}
// outcomes the model never reaches
if (!section.papers.length) return Empty(onUpload)
if (section.failed.length) return Recover(section.failed)
if (section.pending) return Progress(section.stage)
}
WHAT THE TEACHER SEES
Use of EvidenceProficient
2 excerpts attached, each traced to a passage

Show the analysis and supporting evidence.

Each state gives teachers a clear next step.

05 · OUTCOMES

From pilot feedback to a live product

These decisions came together in Group Analysis and Growth Over Time, both live as of September 2026. The redesign gave teachers a faster starting point for reviewing work, with evidence they could inspect themselves.

LIVEGroup Analysis
Review student performance across a class.
Designed
Built
Live
LIVEGrowth Over Time
Compare a student’s work across assignments.
Designed
Built
Live
THE REDESIGN, APRIL TO AUGUST 2026
April 2026COMPLETEAugust 2026
The redesign was planned around schools’ budget decisions for the following year. Both features were live by September 2026.
~5 minto analyze a set of 300 student documents
Reviewing an entire grade’s work can take days. LearningPulse prepared an analysis of 300 documents in about five minutes, giving teachers a starting point for their review.
6
New Jersey district pilot signups
3
conference invitations
06 · REFLECTION

What this changed about how I work

Teacher feedback changed both our priorities and the interface I built. Looking back, I would make the tradeoffs clearer earlier and test how people would use the information before investing in it.

DO DIFFERENTLY
Make tradeoffs clear earlier
I pushed for evidence for every student, but I could have explained the cost of leaving students out more clearly before we set the scope. Next time, I would make that consequence part of the requirements discussion.
DO DIFFERENTLY
Test how people would use the information
A simpler prototype could have helped us test whether the writing metrics supported teaching decisions before we invested in the explorer. I would start with the decision a person needs to make, then test whether the information helps.
KEEP
Make the analysis easy to question
The excerpts gave teachers a way to check the analysis and decide whether they agreed. I want to keep building AI tools that support people’s judgment and make the reasoning easy to inspect.

HOW I CONTRIBUTED

Working across design, product, and development helped me keep teacher feedback connected to the requirements and the interface. I could carry decisions about evidence and incomplete results from the prototype into the implementation.

Design
Teacher workflows · evidence navigation · analysis states
Engineering
Vue and TypeScript · interface implementation
Product
Product direction · requirements · pilot feedback · release planning
WHAT I AM TAKING FORWARD

LearningPulse started with a question teachers ask every day: where are my students in their learning? Answering it meant more than making analysis faster. I connected teacher feedback to product requirements, then carried those decisions into the interface. That is the work I want to keep doing: making complex information useful while giving people enough context to make their own decisions.