CASE STUDY · GOTLEARNING
IN PRODUCTION
Designing and shipping an AI analysis system that shows its work
LearningPulse turns student work into instructional insights educators can verify against the original evidence. I lead the workflow from product direction and validation through production implementation.
We shipped V1 in February 2026. Pilot classrooms taught us two expensive lessons. V2 — every student, every criterion, evidence attached — is built on both. The lessons are the case study.
Teachers consistently asked one question: “Where are my students in their learning?” An AI-generated answer had to meet two standards: educators needed to act on it and verify how it was reached.
MESSY INPUTS
Student documents vary in format, readability, completeness.
VARIABLE AI OUTPUTS
TRUST GAP
Teachers need what happened, what it means, what to do next.
Lesson one: the evidence was the product
V1 paired a narrative summary for each criterion with representative excerpts from student work. Pilot feedback made the distinction clear: the excerpts created trust; the summary created work.
“There's a lot of information here… sometimes there's more to read in the analysis than in the student work itself.”
— Pilot teacher, on V1The excerpts. Teachers read the model's claim next to the student's actual sentence and could agree or disagree in seconds. The unit of trust wasn't the summary; it was the checkable evidence.
Walls of prose per criterion, and evidence from only ~5 of 30 students. "Where students are" has to mean every student — not the model's pick of best and worst.
I'd argued for full evidence coverage during build; under time and inference-cost constraints we shipped model-picked exemplars. Pilots priced that tradeoff for us — and set V2's first requirement.
Measurement did not answer the teaching question
To ground "where students are" in something objective, we built NLP writing signals — clarity, academic-writing index, sentence structure, syntactic variety — with cluster views for every class. Rigorous, defensible. We put it in front of pilot teachers anyway; I'm glad we did.
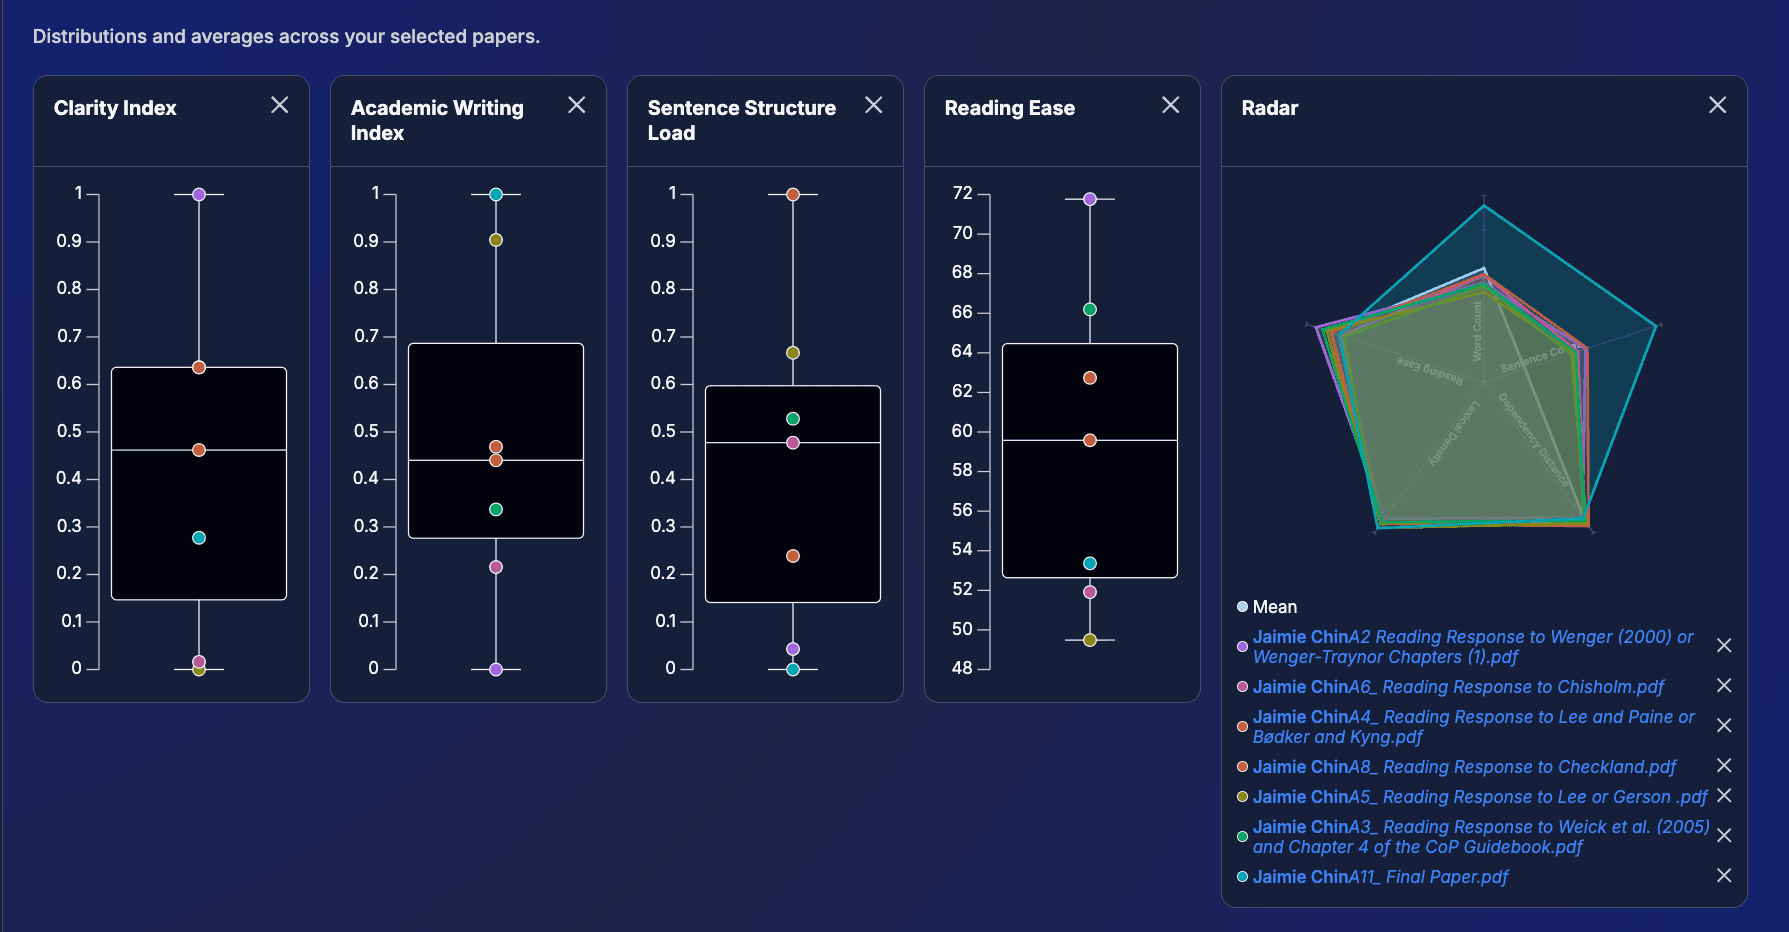
“This looks cool and interesting — but I'm not sure how I would use this information.”
— Pilot teacher, on the cluster viewEngineering's case: teachers can read graphs — don't underestimate them. Mine: reading was never the question. A box plot of Syntactic Variety is reliable — and still can't tell a teacher what to teach on Monday. The gap was interpretability of the metric, not graph literacy.
We killed the direction. Metrics teachers could not translate into instruction lost to claims they could verify against their own criteria.
Grounded isn’t the same as useful — evidence has to speak the user’s language.
Every student, every criterion, evidence attached
We combined both lessons into one system: a 30-second Quick Read, performance bands written in instructional language, and student evidence available behind every claim. Teachers could scan the class, identify where support was needed, and inspect the reasoning without leaving the analysis.
→ evidence for all 30, per criterion
→ Quick Read + bands
→ criteria in teacher language
→ next steps by band

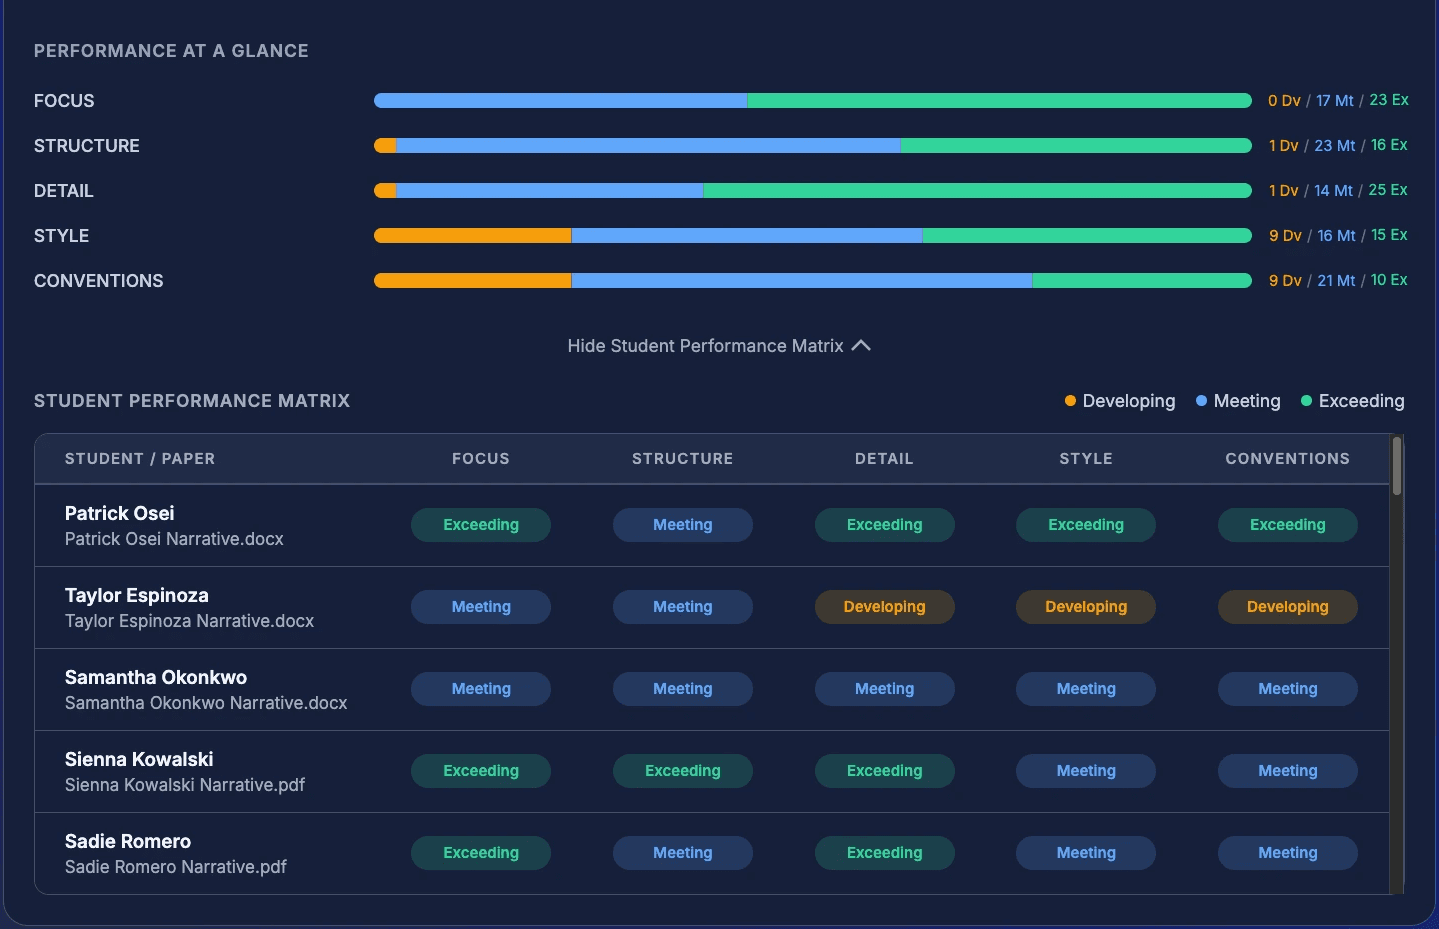
This view also practices what the case study preaches: when a student’s evidence use hasn’t moved, the system says “No Clear Change” — with the receipts. An analysis tool that shows its work must be allowed to report unflattering results.
Trust depends on designing for imperfect output
Underneath the analysis sits a typed contract between model and interface, and a state system that treats empty, partial, and error as first-class designs. Messy uploads and low-signal results are the normal case, not the edge case.
// one shape, every outcome
section {
  title: string
  summary: string
  evidence: Excerpt[]  // may be empty
  status: 'complete'
        | 'partial'
        | 'no_signal'
}SIX STATES, ALL DESIGNED
Complete
Full analysis, all evidence attached
Partial
Some criteria resolved, rest labeled honestly
No signal
Model can’t support a claim — says so
Empty
No papers yet — points to the next action
Error
Failed upload or run — recoverable in place
Loading
Progress that reflects real pipeline stages
The payoff of dependable evidence is time: the reading, comparing, and synthesizing that took days now takes minutes, and the saved hours go to planning interventions.
BEFORE
Days
Reading 30 papers, comparing against criteria by hand, synthesizing patterns from memory.
→
AFTER
Minutes
Quick Read, bands per criterion, evidence one click away — hours saved go to planning interventions.
One role, four functions
As pilots matured, I took the next product cycle end to end: set the direction, wrote the requirements, ran validation interviews on the prototype with pilot teachers, and I’m building it for an August 2026 release — timed to the district budget-planning window, when schools decide what next year looks like.
The most important part of this cycle was not any individual screen. It was making and carrying the product decisions across research, requirements, design, and implementation.
Direction
Requirements
Validation interviews
August 2026 build
What the pivot taught me
Fight scoping battles with cost framing, earlier.
I pushed for full evidence coverage but didn’t frame the product cost early enough. Next time, I’d make the tradeoff explicit before scope is set.
Test interpretability before engineering investment.
The signal explorer was weeks of build to learn what a paper prototype could have surfaced in a day — not “can teachers read this?” but “can teachers act on this?” Test for the decision first.
Honest systems age well.
Everything that survived — excerpts, bands in teacher language, explicit empty and error states, “No Clear Change” — is the same move: show the work, keep the human in charge.
All metrics reflect actual project results. Product screenshots show demonstration data; student and participant names are fictional.